In research, especially in medical research, we describe characteristics of our study populations through Table 1. Table 1 contains information about the mean for continue/scale variable, and proportion for a categorical variable. For example, we say that the mean of systolic blood pressure in our study population is 145 mmHg, or 30% of participants are smokers. Since is called Table 1, means that is the first table in the manuscript.
To create the Table 1 sometimes it can be very time-consuming. Imagine if we have 10 variables (e.g. age, gender.. etc) for 3 groups, and for each variable we compute mean (standard deviation) and a number of participants (proportion); in the end, we have to fill 60 numbers in the table. Moreover, we usually export the table from R to Microsoft Word, and we can be prone to making mistakes if we’re copy/pasting. Therefore, I did a search to find a simple and comprehensive way to make Table 1 with R. I found two very interesting packages named “Tableone” and “ReporteRs”. The TableOne package is created by Kazuki Yoshida and Justin Bohn and is used to create the Table 1 in R. The ReporteRs package is created by David Gohel and in this post I use for exporting Table from R to Microsoft Word.
Create Table 1
I simulated a dataset by using functions rnorm() and sample(). You can download this simulated data set on you desktop to replicate this post. To learn how to upload your dataset into R read this post.
dt <- read.csv(file.choose(), header=TRUE, sep=",")
head(dt)
  Age Gender Cholesterol SystolicBP  BMI Smoking Education
1 67.9 Female       236.4      129.8 26.4     Yes      High
2 54.8 Female       256.3      133.4 28.4      No    Medium
3 68.4   Male       198.7      158.5 24.1     Yes      High
4 67.9   Male       205.0      136.0 19.9      No       Low
5 60.9   Male       207.7      145.4 26.7      No    Medium
6 44.9 Female       222.5      130.6 30.6      No       Low
Now I will use the package TableOne to create the Table 1. First I will load the package and then will create the list of variables which I want to place on Table 1. Secondly, I will define the categorical variables.
#Load package
library(tableone)

#Create a variable list which we want in Table 1
listVars <- c("Age", "Gender", "Cholesterol", "SystolicBP", "BMI", "Smoking",
"Education")

#Define categorical variables
catVars <- c("Gender","Smoking","Education")
My first interest is to make the Table 1 for total population.
#Total Population
table1 <- CreateTableOne(vars = listVars, data = dt, factorVars = catVars)
table1
                         Overall
  n                          250
  Age (mean (sd))          57.50 (7.85)
  Gender = Male (%)          107 (42.8)
  Cholesterol (mean (sd)) 224.12 (24.90)
  SystolicBP (mean (sd))  145.51 (10.08)
  BMI (mean (sd))          26.79 (4.37)
  Smoking = Yes (%)           72 (28.8)
  Education (%)
     High                    108 (43.2)
     Low                      71 (28.4)
     Medium                   71 (28.4)
But, often I am interested to create Table 1 for men and women and to compare their means and proportions. To compute this I run the code below.
# Removing Gender from list of variables
listVars <- c("Age", "Cholesterol", "SystolicBP", "BMI", "Smoking", "Education")
table1 <- CreateTableOne(listVars, dt, catVars, strata = c("Gender"))
table1
                         Stratified by Gender
                          Female         Male           p      test
  n                          143            107
  Age (mean (sd))          56.94 (8.05)   58.25 (7.55)   0.191
  Cholesterol (mean (sd)) 224.80 (25.06) 223.21 (24.78)  0.620
  SystolicBP (mean (sd))  144.95 (10.99) 146.27 (8.71)   0.305
  BMI (mean (sd))          26.74 (4.58)   26.84 (4.09)   0.859
  Smoking = Yes (%)           37 (25.9)      35 (32.7)   0.298
  Education (%)                                          0.289
     High                     56 (39.2)      52 (48.6)
     Low                      45 (31.5)      26 (24.3)
     Medium                   42 (29.4)      29 (27.1)
You can do a lot more with the TableOne package. For example, you can compute median and inter-quartile range for non normally distributed variables, and run different tests for comparison of the groups.
Export Table 1 from R to Microsoft Word
Now that I have Table 1 ready I want to transfer Table 1 to Microsoft Word document. For this purpose I will use the function FlexTable() from the package "ReporteRs". I found a very good script in StackOverflow to achieve this task. I am sharing the code below. (Credits to the author in StackOverflow).
table1 <- print(table1)

# Load the packages
library(ReporteRs)
library(magrittr)

# The script
docx( ) %>%
     addFlexTable(table1 %>%
     FlexTable(header.cell.props = cellProperties( background.color = "#003366"),
               header.text.props = textBold( color = "white" ),
               add.rownames = TRUE ) %>%
               setZebraStyle( odd = "#DDDDDD", even = "#FFFFFF" ) ) %>%
     writeDoc(file = "table1.docx")
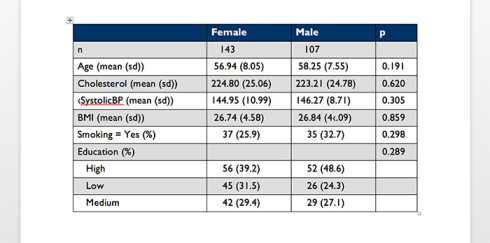
Finally, you will have the Table 1 ready for submission.
Here the screenshot of my Table 1.

If you have any comment or feedback feel free to post a comment below.