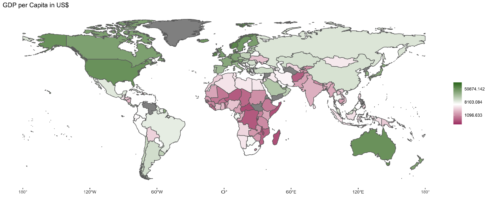
Choropleths are a nice tool for the visualization of geographic data and with R and Python, their creation can be pretty effortless, especially when clean data is readily available. Fortunately, a lot of economic datasets can be loaded from the World Bank Open Data platform. Nevertheless, making the visualization look nice can be a bit cumbersome. For this reason, I have created a small, integrated function that is handling the data download, adjustment, and visualization all in one. The output can easily be exported as high-quality vector-graphic using ggsave.
To replicate the example, simply follow these three steps.
1) Install all required packages
install.packages("rnaturalearth")
install.packages("rnaturalearthdata")
install.packages("WDI")
install.packages("lubridate")
install.packages("dplyr")
install.packages("ggplot2")
install.packages("RColorBrewer")
install.packages("ggplot2")
2) Load the function
#Download and visualization function
get_and_plot_wb_data<-function(sel_indicator="NY.GDP.PCAP.KD",
                               log="Yes",
                               midpoint="Mean",
                               color_scheme="Straight",
                               start_yr = year(Sys.Date())-2,
                               end_yr = year(Sys.Date()),
                               legend_pos="Bottom",
                               charttitle="GDP per Capita in US$",
                               scale_factor=1)
{
#Load required packages
library(rnaturalearth)
library(rnaturalearthdata)
library(WDI)
library(lubridate)
library(dplyr)
library(ggplot2)
library(RColorBrewer)
library(ggplot2)

#Create color scheme
cols_gr<-c("#632523", "#953735",  "#C3D69B","#77933C", "#4F6228")
cols_gr = colorRampPalette(cols_gr)(5)

#Get all countries and countrycodes
world <- ne_countries(scale = "medium", returnclass = "sf")
class(world)

#Load data using the worldbank API
gdp<-WDI(
  country = "all",
  indicator = sel_indicator,
  start = start_yr,
  end = end_yr,
  extra = FALSE,
  cache = NULL,
  latest = NULL,
  language = "en"
)

names(gdp)[1]<-"iso_a2"
names(gdp)[names(gdp)==sel_indicator]<-"ret"
gdp<-gdp[order(gdp$country,gdp$year),]
print(max(gdp$year))
gdp% group_by(iso_a2) %>% do(tail(., n=1))


world<-merge(world,gdp,by="iso_a2",all=F)

#Remove some unnecssary elements
plain <- theme(
  panel.background = element_rect(fill = "white"),
)

world$ret<-round(world$ret/scale_factor,2)
#Choose appropriate breakpoint
if(midpoint=="Median")
{
  midpoint<-median((world$ret),na.rm=T)
}else{
  if(midpoint=="Mean")
  {
    midpoint<-mean((world$ret),na.rm=T)
  }else{
    midpoint<-midpoint
  }
}

#Red to green or green to red
if(color_scheme=="Inverted")
{
  col_low<-"#276419"
  col_high<-"#8E0152"
}else{
  col_low<-"#8E0152"
  col_high<-"#276419"
}

#Plot map with ggplot

p9<-
  ggplot(data = world) +
  geom_sf(aes(fill = (ret))) +
  ggtitle(charttitle) +
  #theme(legend.position = legend_pos,legend.margin=margin(-10,-10,-10,-10),legend.box.margin=margin(-100,800,-50,-50))+
  plain

#Use log scale for skewed data
if(log=="Yes")
{
  p9<-p9+
    scale_fill_gradient2(
      trans = "log",
      low = col_low,
      mid = "white",
      high = col_high,
      midpoint = log(midpoint),
      space = "Lab",
      na.value = "grey50",
      guide = "colourbar",
      aesthetics = "fill",
      name=""
    )
}else{
  p9<-p9+
    scale_fill_gradient2(
      low = col_low,
      mid = "white",
      high = col_high,
      midpoint = midpoint,
      space = "Lab",
      na.value = "grey50",
      guide = "colourbar",
      aesthetics = "fill",
      name=""
    )
}

res_list<-list("dataset"=world,"visualization"=p9)

return(res_list)

}
3) Run the function and save the plot
#Run the function
res_list<-get_and_plot_wb_data(sel_indicator="NY.GDP.PCAP.KD",midpoint="Median",log="Yes",legend_pos="bottom",charttitle="GDP per Capita in US$",scale_factor=1)
res_list$visualization

#Export the result
target_folder<-"C:/your_path/"
ggsave(file=paste0(target_folder,"gdp_per_capita.svg"), plot=res_list$visualization, width=14, height=7)
